Draw an ER Diagram with Lucidchart for the "Salon Appointment Scheduler" project


In this tutorial, we will learn how to draw an "Entity-Relationship Diagram" with Lucidchart and we will use the project called "Salon Appointment Scheduler" from the freeCodeCamp "Relational Database" Curriculum as a base for our examples.
In this way, at the end of this tutorial, we will have a nice diagram that will allow us to have a clear vision of the structure of our database. Later, it will be easier for us to code the database.
Among several available diagrams, I have chosen "Crow's Foot" for its simplicity.
We will also use Lucidchart to create the ERD but we could also use pen and paper.
Don't you know what I'm talking about? Then here's some theory.
Theory
What is an ERD?
It is an abstraction, a visual representation of the database design and it comprehends the entities and the relationships between them. ER diagrams are a useful tool for designing and visualizing the structure of a database. They help us to understand how the data in the database is related and how it can be accessed and updated.
What is an entity?
In an entity-relationship (ER) diagram, an entity is a representation of a real-world object or concept that exists independently and can be uniquely identified. For example, a customer, an employee, or a product could all be entities in a database.
In an ER diagram, an entity is represented by a rectangle. The name of the entity is written inside the rectangle, and the attributes of the entity are listed inside the rectangle or in a separate box connected to the rectangle by a line. For example, if the entity is a customer, the attributes might include the customer's name, address, and phone number.
What are relationships?
ER diagrams are used to model the relationships between entities in a database. These relationships are represented by lines connecting the entities. The type of relationship is indicated by the symbol at the end of the line. For example, a line with a crow's foot symbol at the end indicates a many-to-many relationship.
Lucidchart
To draw a diagram I wanted a tool that was easy to use, free, and required no software installation. I found Lucidchart.
Lucidchart is a web-based diagramming application that allows users to visually collaborate on drawing, revising and sharing charts and diagrams [...]
We can sign up for free and we don't need to install anything, but our limit as a free user is to have 3 diagrams.
I am not affiliated, but it is just an interesting tool.
Create the ERD from a template
We could start with a blank project but we can also save extra time by using a template.
We can create our diagram from a template by clicking on the "+ New" button then selecting "Lucidchart" and then "Create from template".
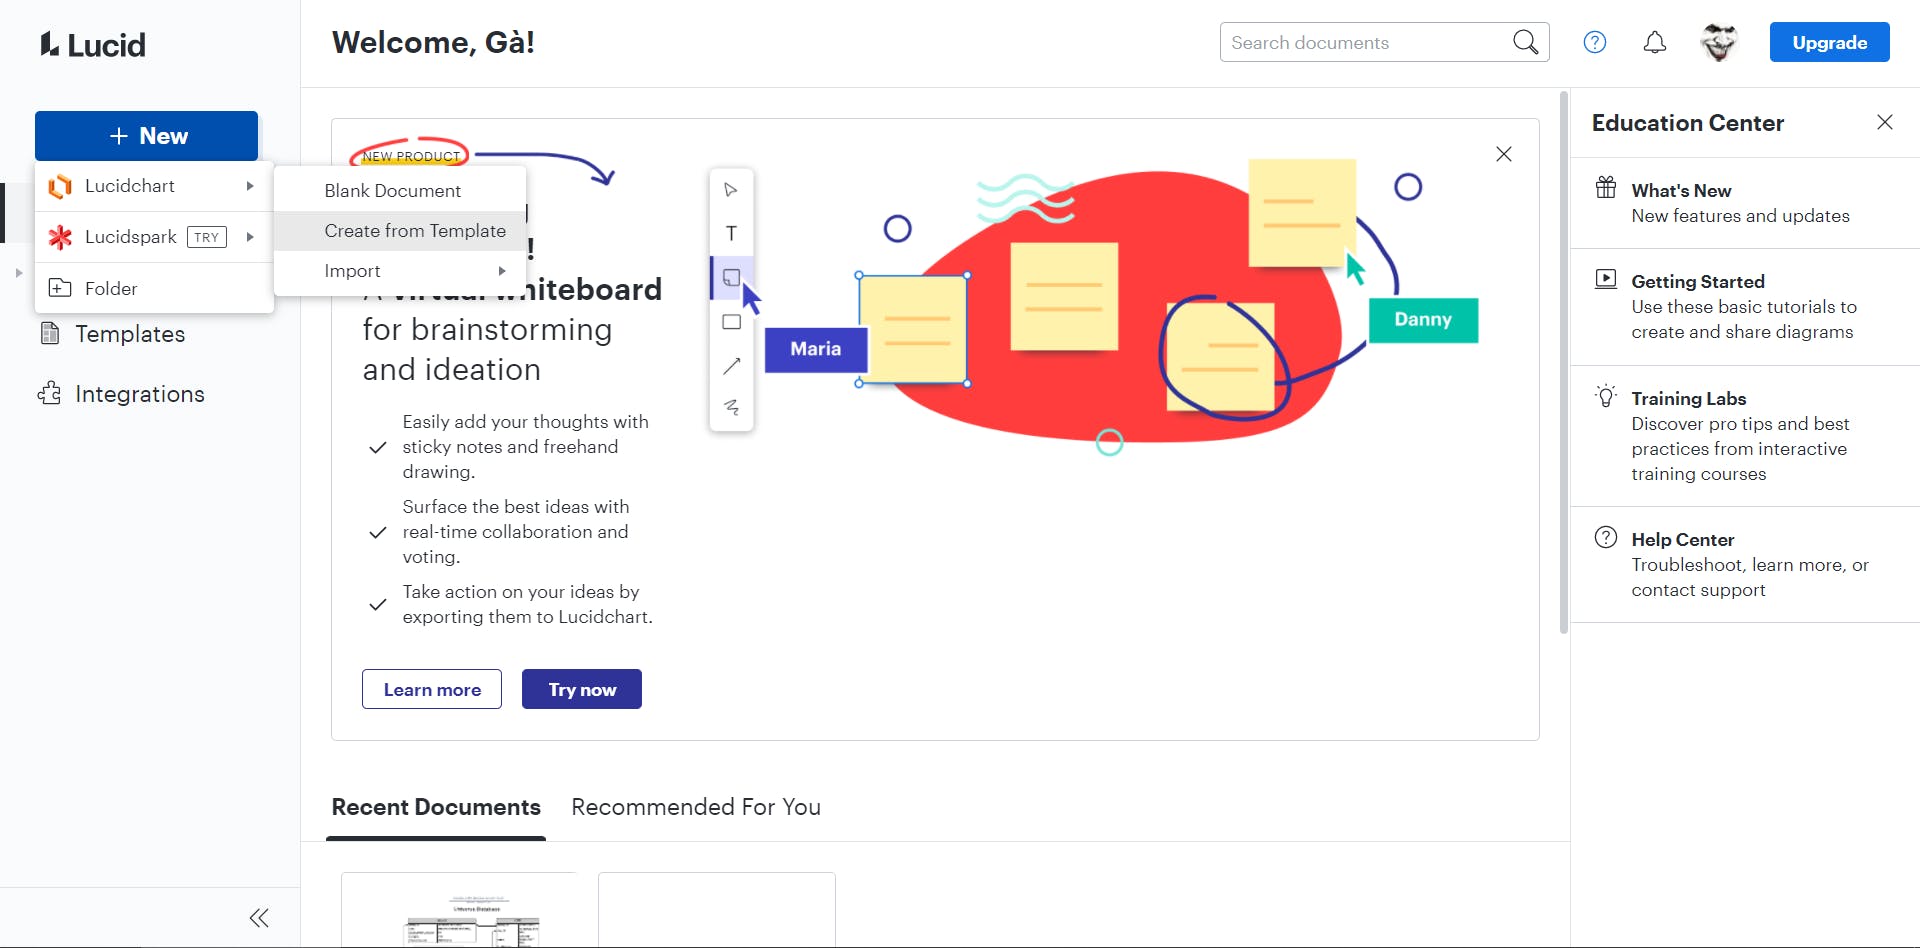
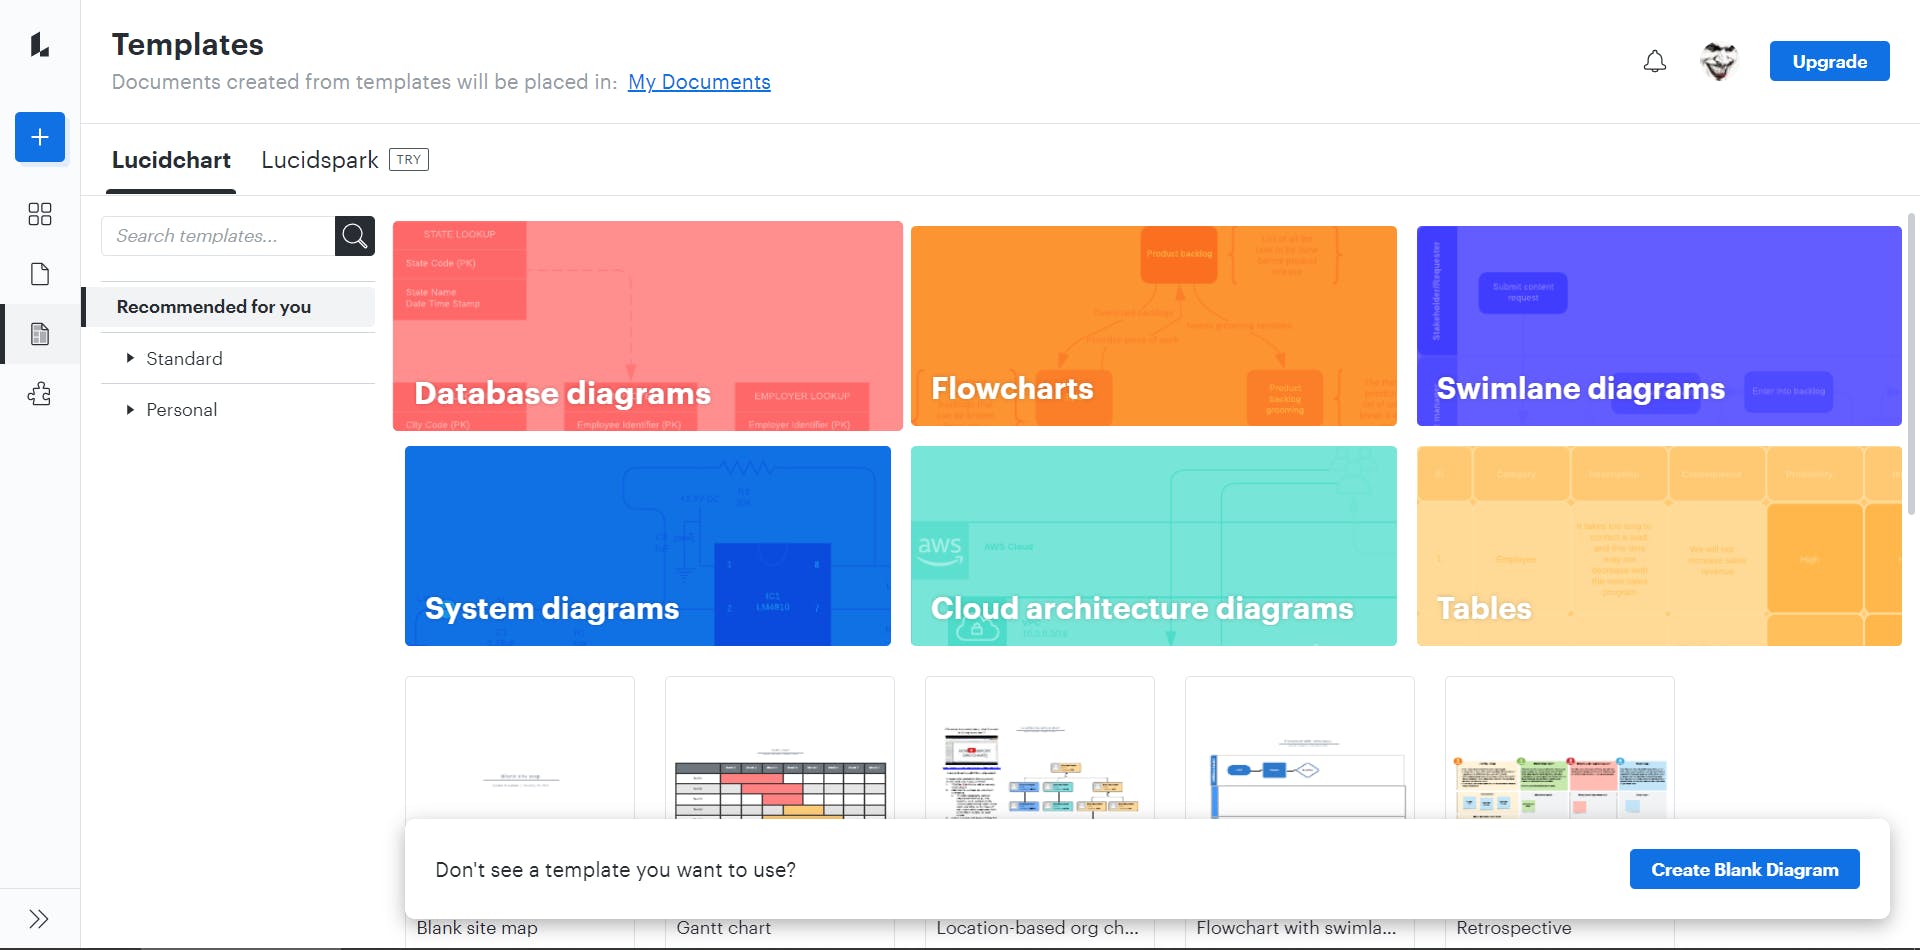
Lucidchart will show to us a list of recommended diagrams.
Choose "Database diagram".
and from this list pick "Database ER diagram (crow's foot)".
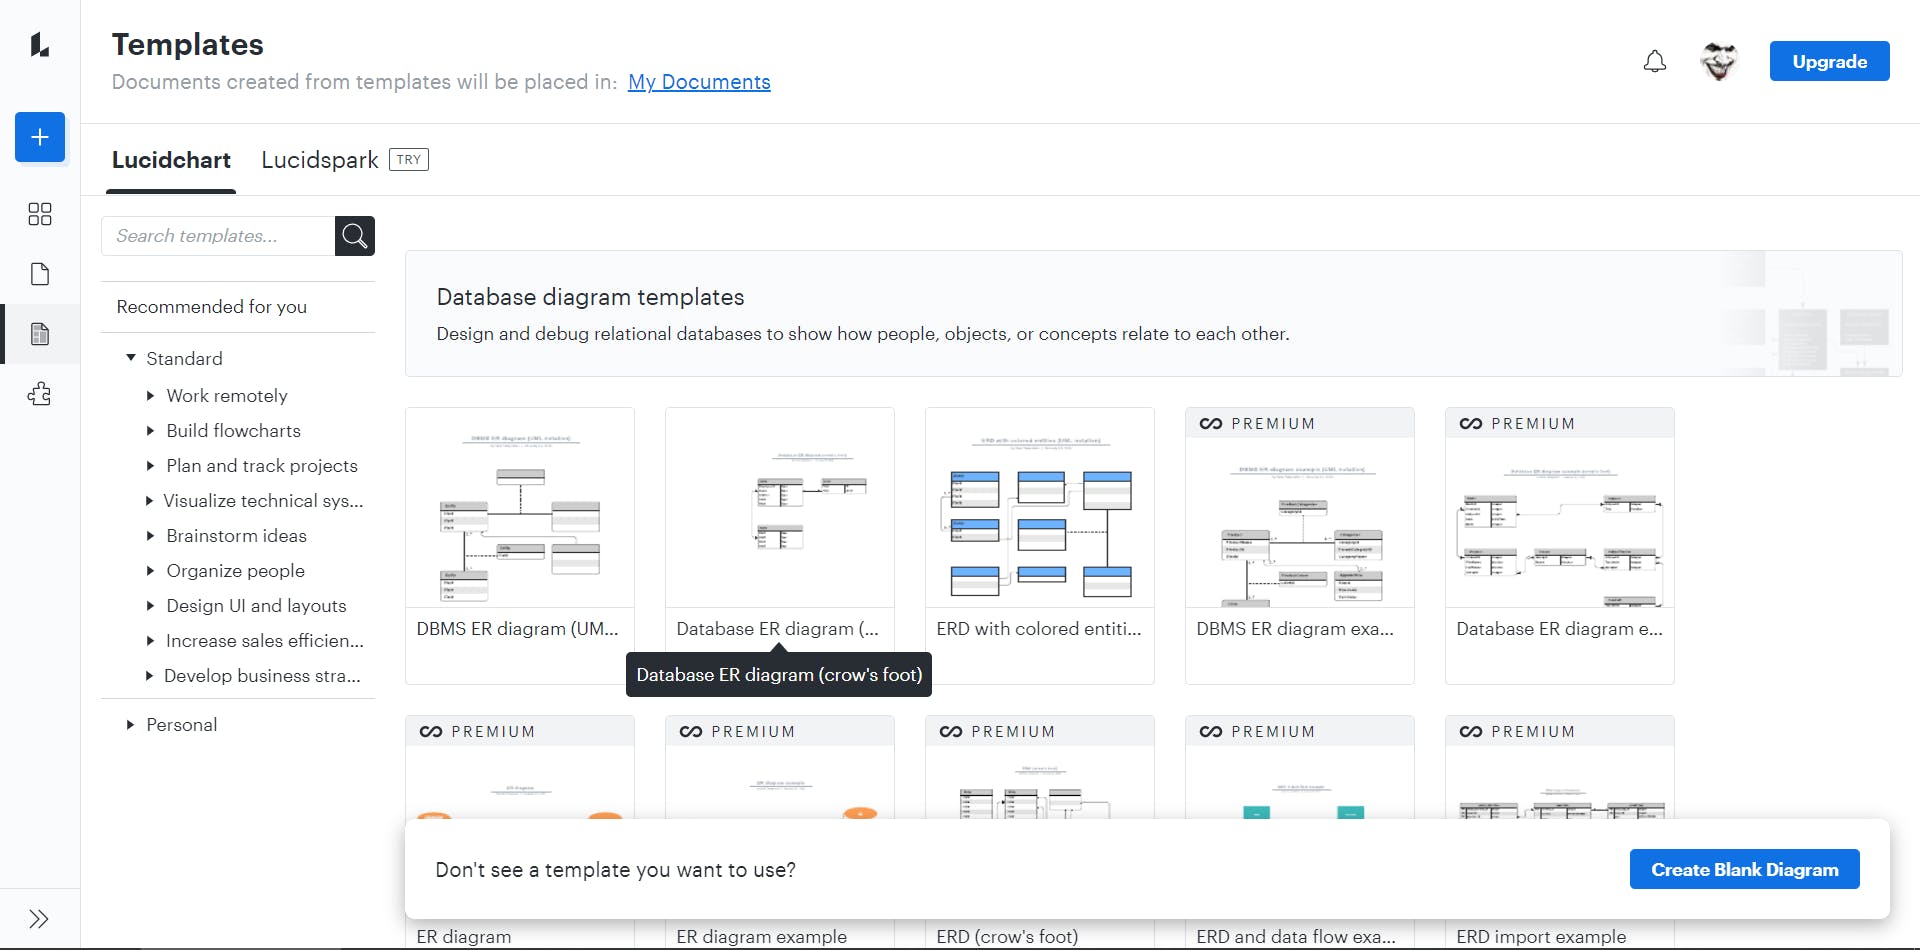
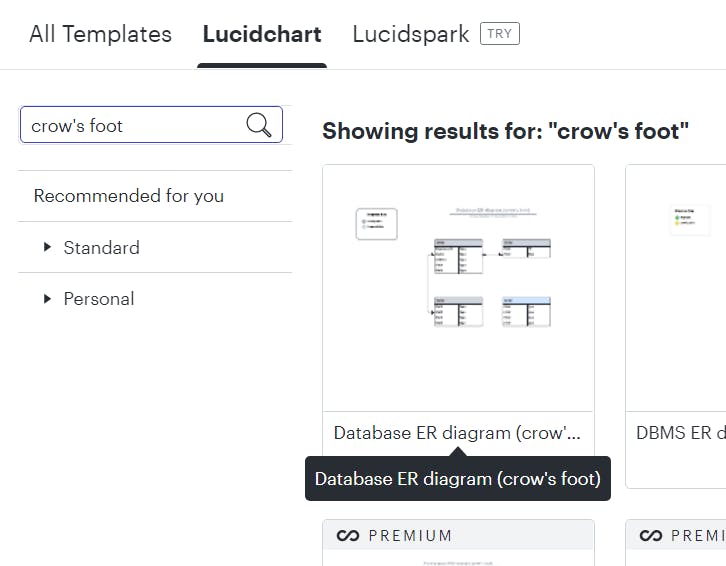
We can also use the search bar to quickly find the diagram we want by typing "crow's foot".
Once selected a new window opens up and we click on the blue button that says "Use template".
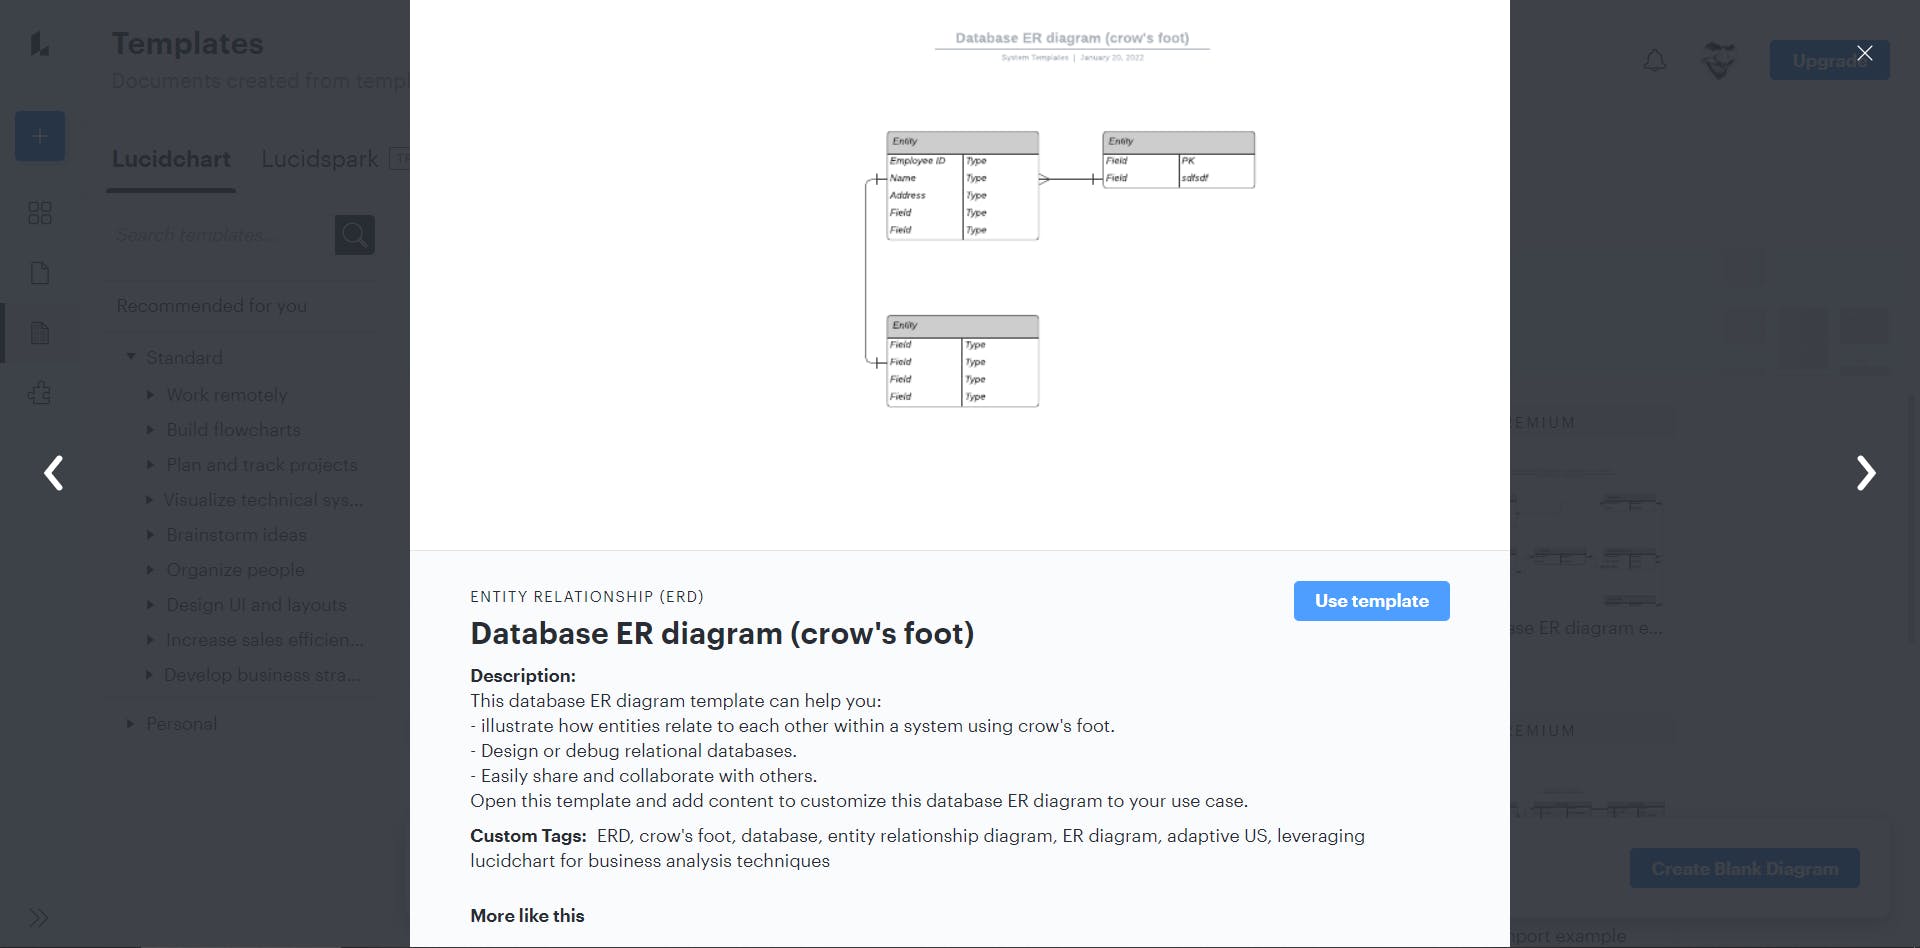
Our template is now ready to be modified to suit our database structure.
Tasks
Let's start by reading all the tasks one by one and let's draw our diagram elements.
You should create a database named "salon"
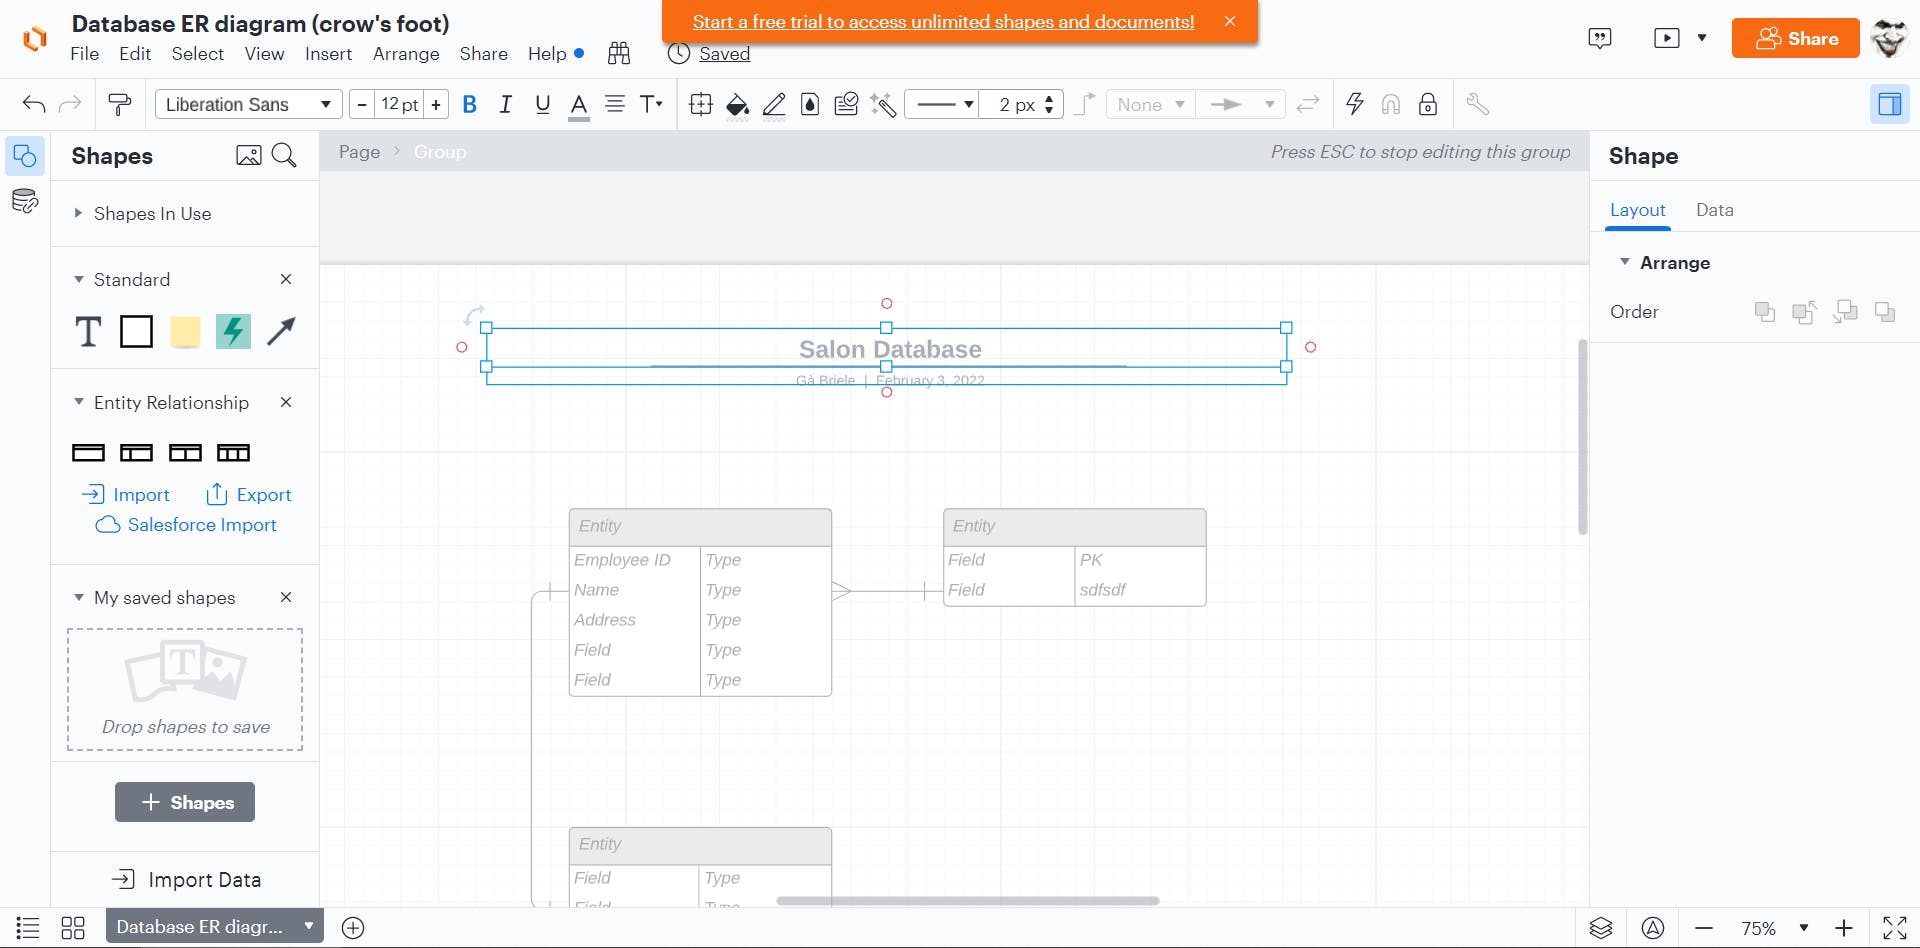
Simply change the title to "Salon Database". Double-click the title to edit it.
You should connect to your database, then create tables named customers, appointments, and services.
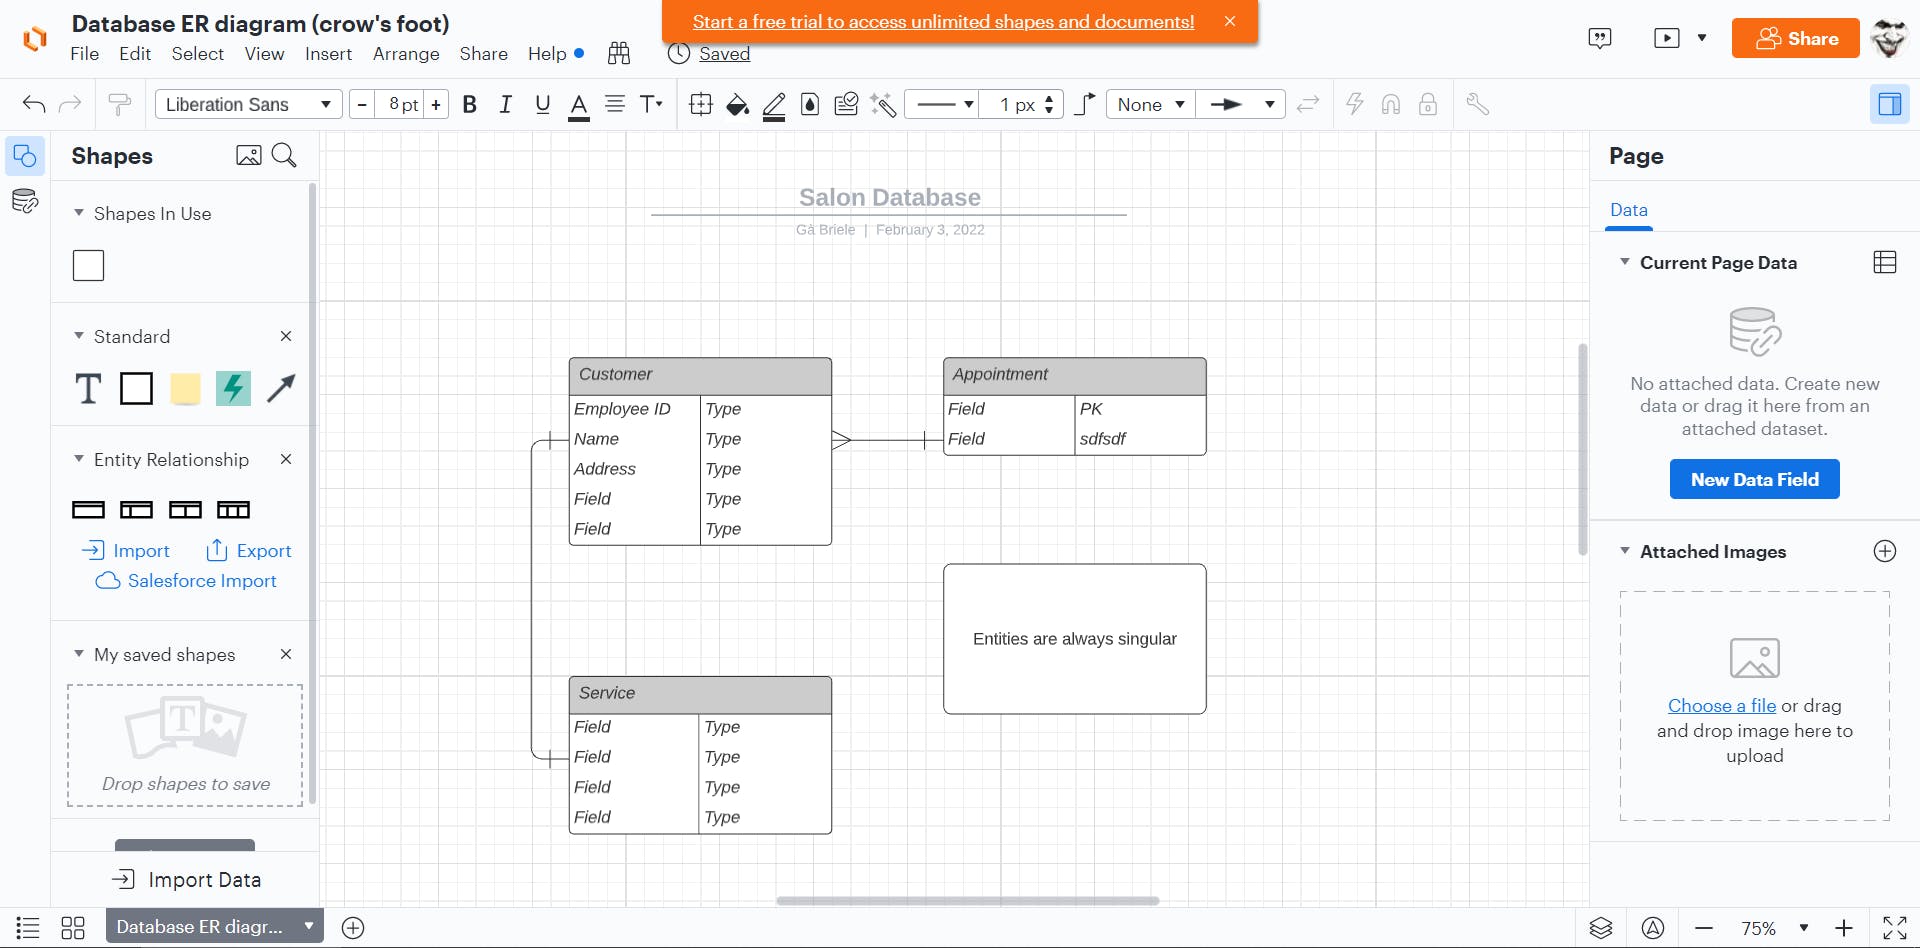
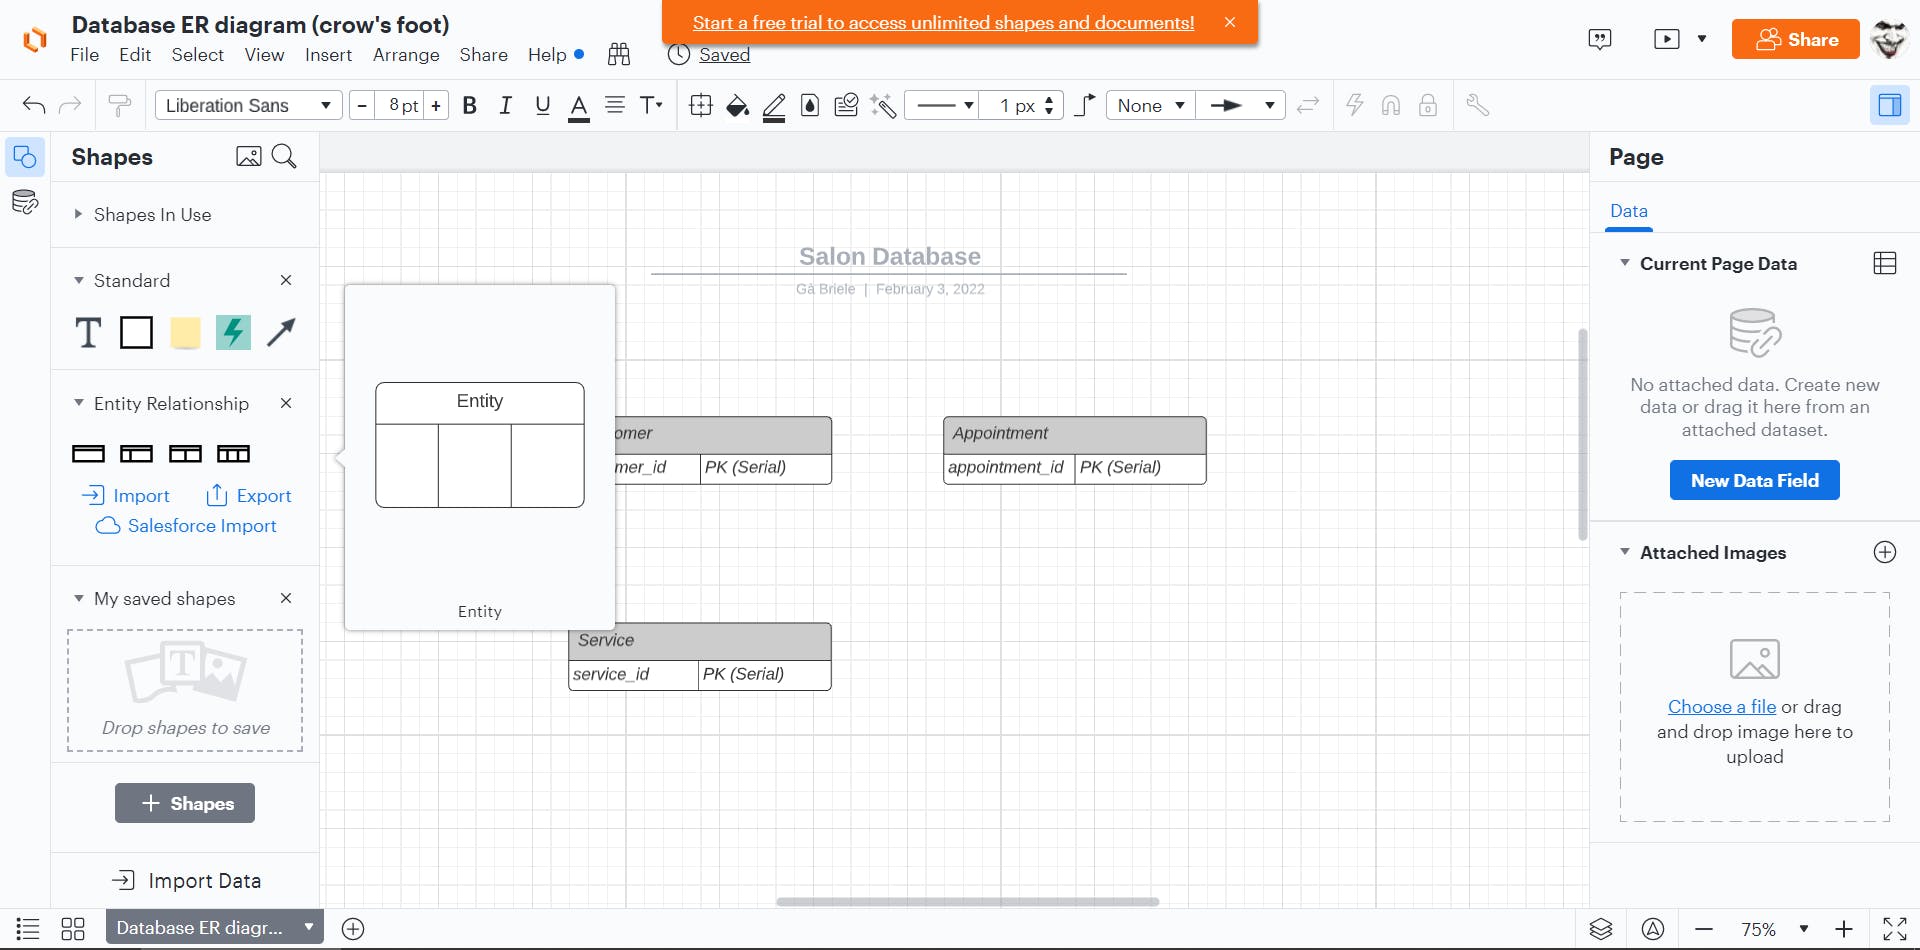
Edit the name of the entities. Double-click on the title of each box to rename them.
Each table should have a primary key column that automatically increments.
Each primary key column should follow the naming convention, table_name_id. For example, the "customers" table should have a customer_id key. Note that there are no s at the end of "customer".
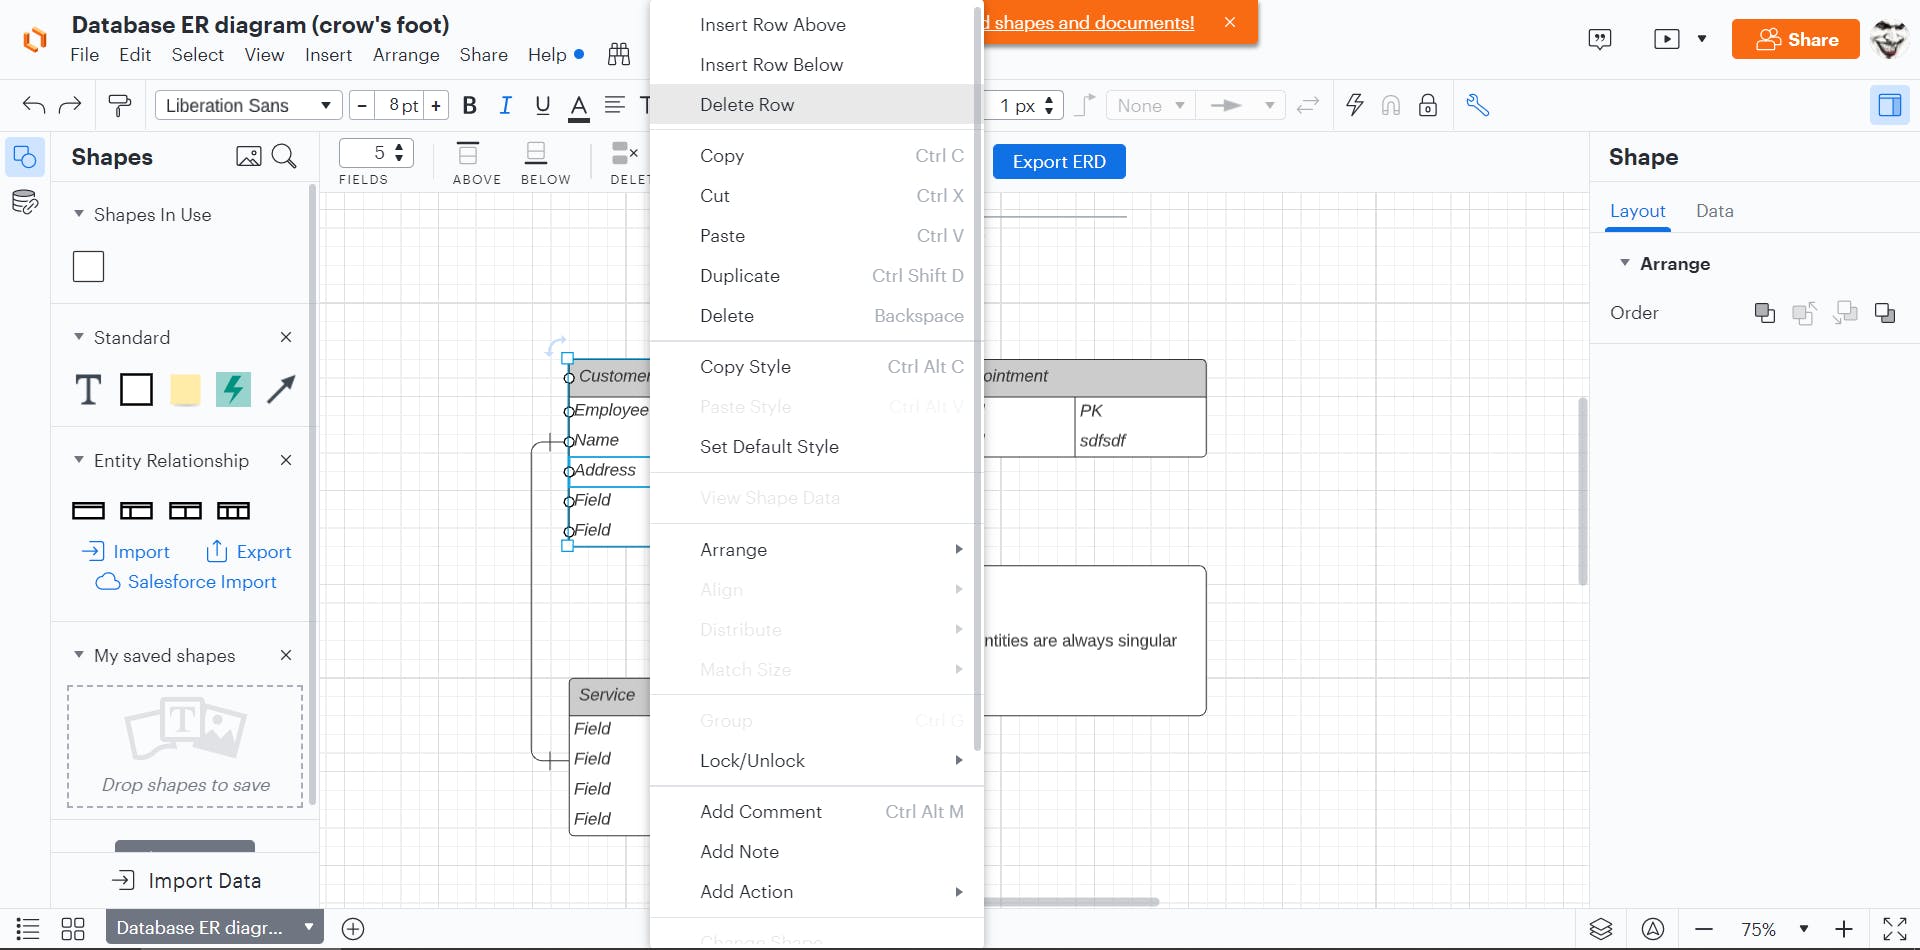
First, delete the extra columns from our template. To do this, click on a field to select it, then right-click and choose "Delete Row".
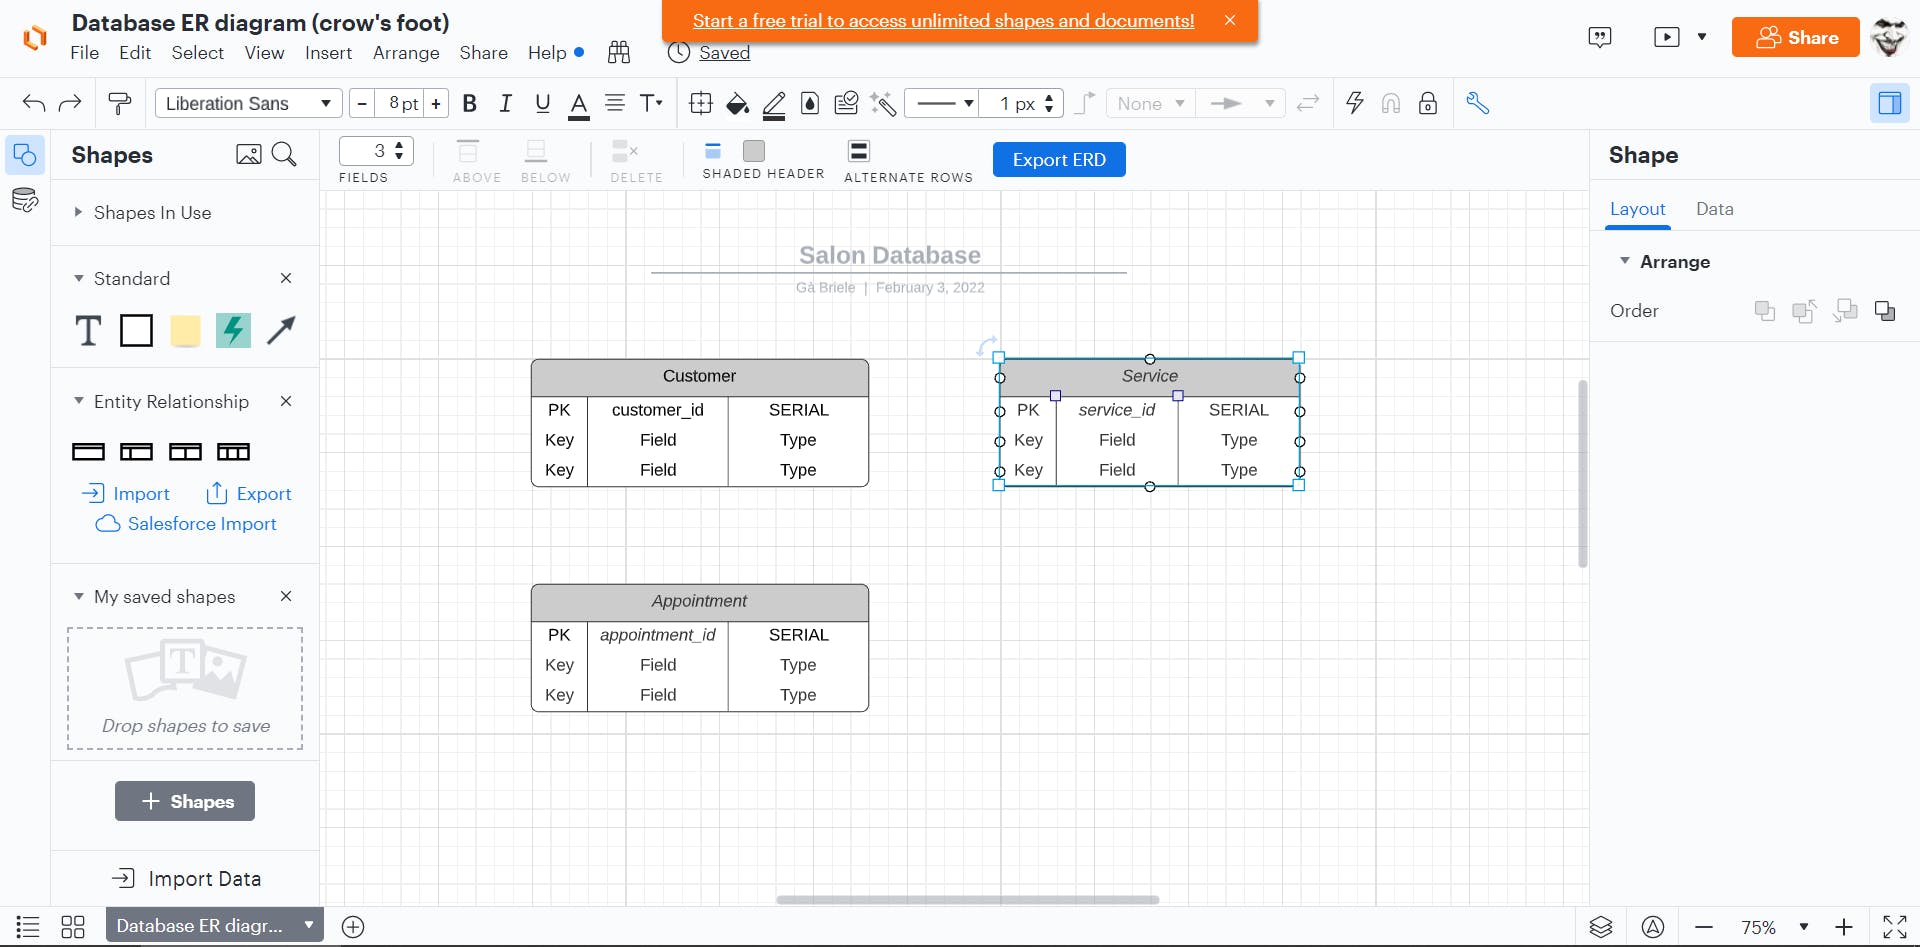
On the left panel, we change the layout to three columns instead of two, so we can have: KEY | FIELD | TYPE
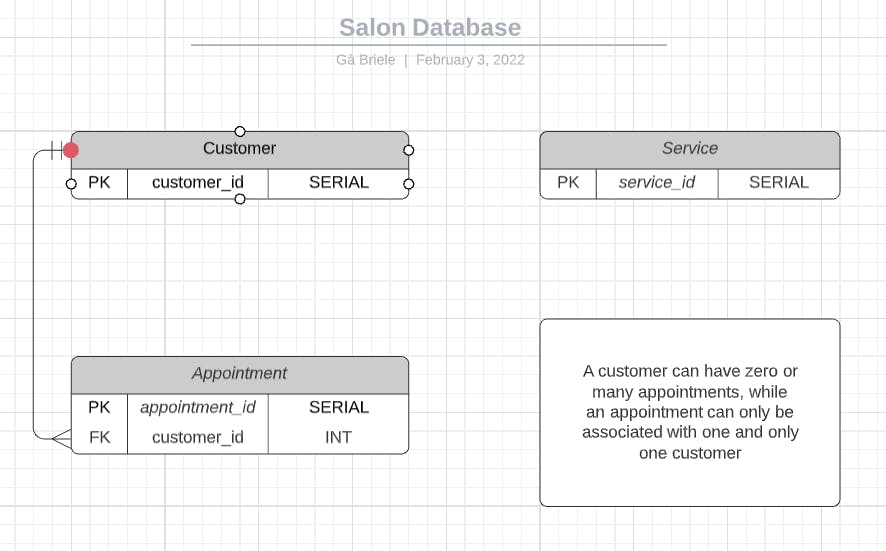
Your "appointments" table should have a customer_id foreign key that references the customer_id column from the "customers" table.
We create a relationship between two tables by drawing a line. The extremities of the line specify cardinality.
Your appointments table should have a service_id foreign key that references the service_id column from the services table.
Your "customers" table should have a "phone" column that is a VARCHAR and must be unique.
Your customers and services tables should have a name column
Your appointments table should have a time column that is a VARCHAR
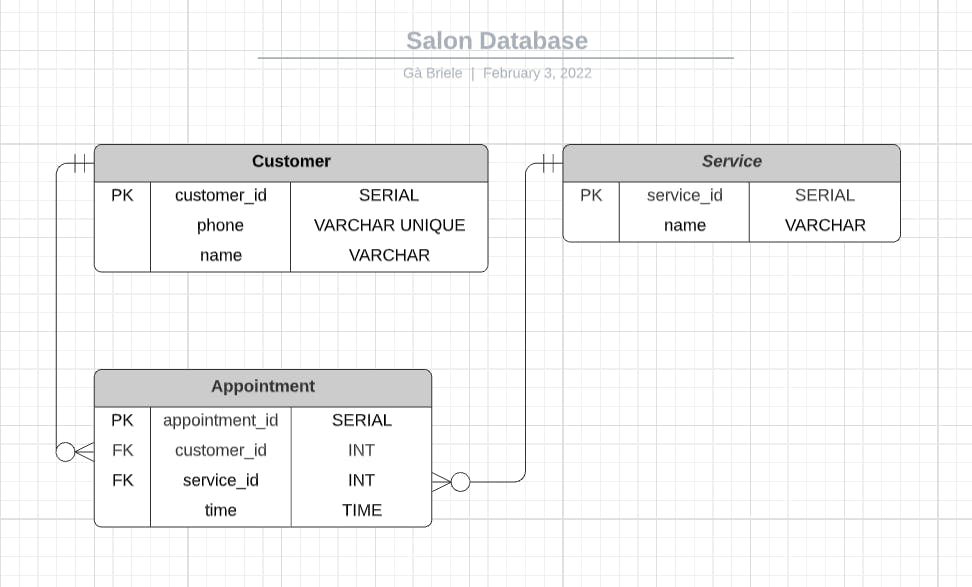
Et voila the job is done.
This is my third article on medium for the 2022 Become-a-Dev New Year's Resolution Challenge Step #4: "Publish 3 tutorials on your Hashnode blog" I hope you enjoyed it.
With this last step, I completed the challenge.